Digital mapping for business platforms: stakes, architecture & best practices
By Khalid Yagoubi - Publication : 09 Feb, 2026
6 min read

KERN IT Vision: Field insights and KERN MAP presentation
At KERN IT, mapping is not just a graphical component added at the end of a project.
In many cases, it is the platform’s digital heart; the primary entry point for understanding, exploring, and leveraging data.
With time and field experience, we have learned one essential thing: a poorly conceived map weakens the entire system, while a well-architected one becomes a powerful strategic lever.
This article is intentionally comprehensive.
It shares our vision, real-world feedback, and architectural choices, while introducing KERN MAP; our mapping component designed for demanding projects.
Expertise built on real-world projects, not just demos
For several years, KERN IT has been designing, taking over, and scaling mapping platforms facing real-world challenges:
- Large volumes of geographic data
- Advanced search and complex business filters
- Decision-oriented visualization
- High performance and reliability constraints
- Projects designed to last for years
We have worked on platforms ranging from a few hundred to several tens of millions of geographic points, often distributed over time, enriched, aggregated, and utilized by different user profiles.
One observation consistently emerges: mapping failures almost never stem from a lack of data, but from a naive approach to architecture and usage.
Not all maps are created equal
Talking only about "size" in terms of point counts is misleading.
The true complexity of a mapping platform depends on the combination of volume, density, search, temporality, and business logic.
Level 1: Simple informative mapping
Scale : 10 to 200 points
- Static data
- Few interactions
- Occasional usage
Example
A showcase website listing offices, stores, or public places.
👉 A standard map is more than enough.
Level 2: Structured business mapping
Scale : 200 to 5,000 points
- Structured data
- Business filters
- Need for readability and searchability
Example
A B2B real estate portfolio with several thousand properties filterable by status, area, typology, and zone.
👉 The limits of generic solutions quickly become apparent.
Level 3: Data-driven mapping
Scale: 5,000 to 500,000 points
- Dynamic or historical data
- Multi-criteria search
- Calculations and aggregations
- Multiple users
Example
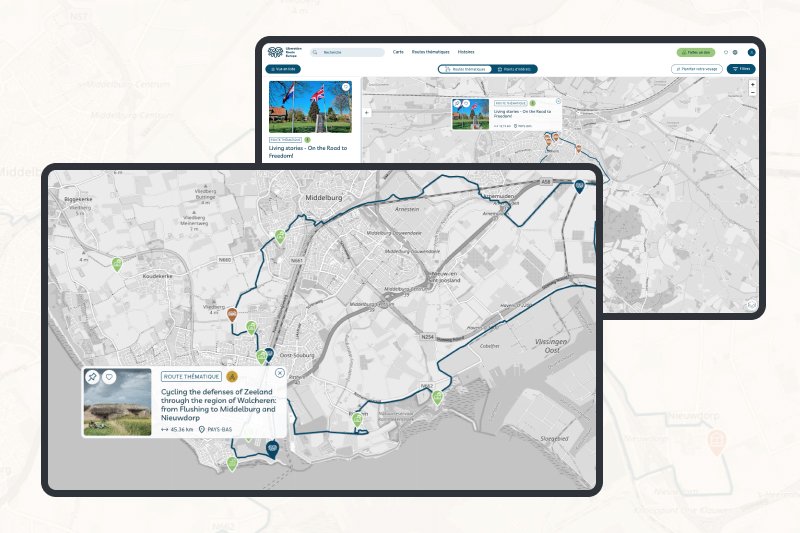
A territorial platform with geolocated events spanning several years, filterable by period and category.
👉 Mapping becomes a complete system in its own right, not just a component.
Level 4: Massive mapping / Big Geo Data
Scale: beyond 500,000 points, up to several tens of millions
- Multi-source data
- Long historical data
- Critical volume
- Business decisions based on the map
Example
A platform utilizing over 30 million cumulative geographic points, searchable by zone, period, and typology.
👉 At this level, mapping is a product with its own dedicated architecture.
The true complexity drivers
It is not volume alone that makes a mapping project complex, but the combination of factors such as:
- Multi-criteria search
- Temporal data
- Spatial calculations
- Frequent updates
- Multi-user environments
- Business decisions based on the map
As soon as several of these elements are present, a specific architecture becomes indispensable.
Mapping debt: an often underestimated risk
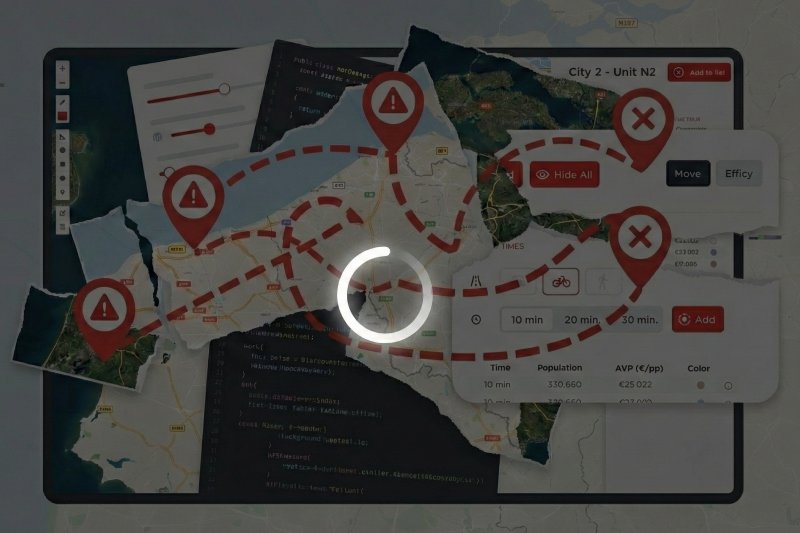
Like technical debt, mapping debt accumulates when:
- All data is loaded on the front-end
- Business logic is buried within the map
- Calculations are performed in the wrong place
- The map becomes impossible to evolve
The result: slow, fragile, and costly platforms that are often abandoned after a few years.
At KERN IT, we are frequently called upon to take over existing mapping projects and rebuild their foundations.
Performance: an architectural decision, not a late optimization
In mapping, performance is not something you fix at the end.
The real questions are:
- What data should be loaded?
- When should it be loaded?
- At what zoom level?
- In what aggregated form?
The wrong answers lead to:
- Slow maps
- Unnecessary infrastructure costs
- A degraded user experience
- Decisions based on misinterpretations
Mapping performance is, first and foremost, a data architecture decision.
Geospatial clustering: Client or Server ?
Clustering is often presented as a simple visual effect.
In reality, it is a structural architectural choice.
Client-side clustering
Principle
The points are loaded into the browser and then dynamically grouped according to the zoom level.
Advantages
- Fast implementation
- Low back-end complexity
Limitations
- All data must be loaded
- High memory consumption
- Dependent on the user's hardware
- Impossible at scale
👉 Best suited for a few hundred or thousand points.
Server-side clustering
Principle
Data is aggregated on the server side according to:
- Visible area
- Zoom level
- Business filters
- User context
The client receives only relevant clusters, never the raw data.
Advantages
- Controlled network flows
- Consistent performance
- Front-end independence
👉 Essential as soon as volumes, search complexity, or temporality increase.
Hybrid Approaches
In mature platforms:
- Server-side clustering handles volume
- Client-side clustering refines the rendering
- Transitions are seamless
There is no universal solution, only choices adapted to the business context.
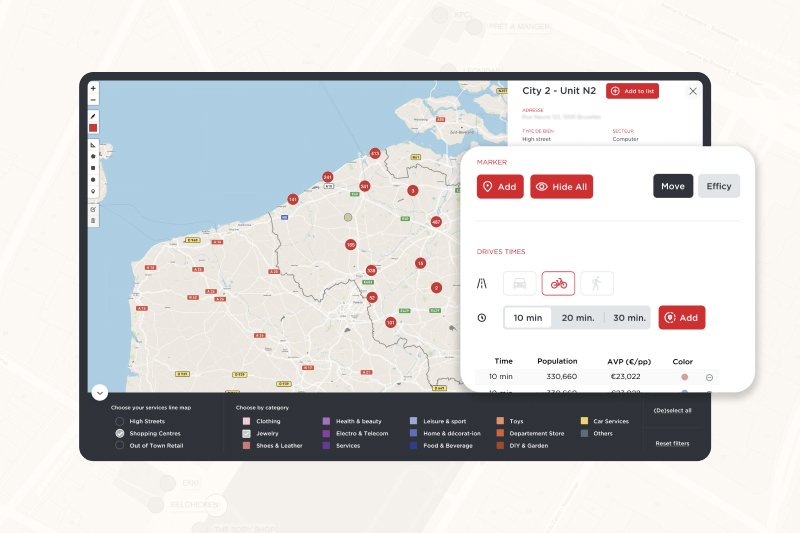
Geographic search: often more critical than the map itself
In many projects, the value lies not in the visualization, but in the ability to find the right information quickly.
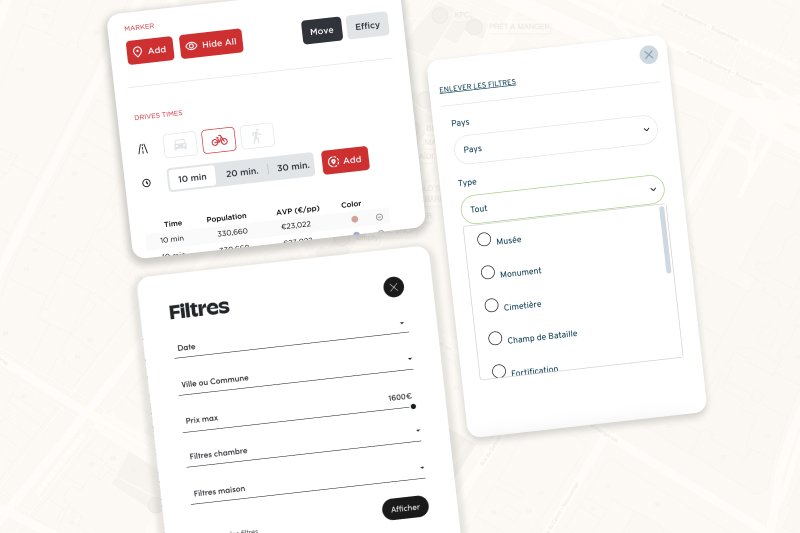
Serious mapping relies on:
- A multi-criteria search engine
- Complex business filters
- Dynamic sorting
- Tight coupling between search and map
The map then becomes the visual projection of the search, and not the other way around.
The temporal dimension, too often forgotten
Most maps are static.
However, business data is almost always evolving.
KERN IT platforms integrate the spatio-temporal dimension:
- Data history
- Comparison of periods
- Replaying past states
- Analysis of territorial evolutions
Indispensable for real estate, urban planning, logistics, or strategic analysis.
KERN MAP: our mapping component for demanding projects
Based on these findings, we have structured our expertise into a dedicated component: KERN MAP.
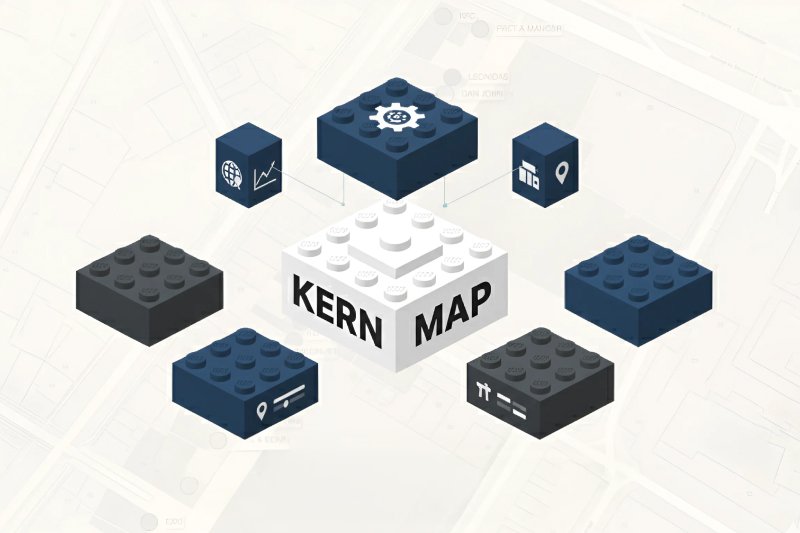
A Lego brick, not a frozen product
KERN MAP is not a generic tool sold as is.
It is a modular mapping brick, born from real-world projects, that we assemble and adapt according to business needs.
It allows you to:
- Accelerate projects without sacrificing customization
- Capitalize on years of field feedback
- Guarantee a sound and maintainable foundation
- Remain independent from proprietary solutions
An architecture designed to scale
KERN MAP is designed to:
- Scale up progressively
- Handle millions of points
- Evolve functionally over time
It is based on:
- Progressive loading
- Server-side aggregation
- Server-side clustering as a foundation
- Strict separation between data, business logic, and rendering
A data-oriented architecture
In KERN MAP, the map is never the source of truth.
Geographic data is central, governed, and reusable beyond the map itself.
This allows for:
- Reliable spatial calculations
- Global business consistency
- Multi-channel exploitation
- Clear data governance
Multi-layer and advanced manipulation
KERN MAP natively manages:
- Hierarchical layers
- Points, lines, and polygons
- Dynamic zones
- Business-specific color coding
- Conditional display rules
The map then becomes an analytical tool, not just a simple display.
Governance, efficiency, and sustainability
KERN MAP is designed for:
- Access rights per layer
- Traceability of modifications
- Purposeful technical sobriety
- Controlled infrastructure costs
We prioritize practical performance over performative display.
A brick also designed to integrate legacy systems
KERN MAP is also used to:
- Take over existing mapping platforms
- Reduce mapping technical debt
- Restore sound foundations
- Secure the future of projects
Conclusion
Mapping is too strategic to be treated as a mere component.
When it becomes critical, the architecture must follow suit.
With KERN MAP, KERN IT transforms mapping into a strategic asset, serving your decisions and your growth.
👉 Do you have a complex mapping project or an existing platform to evolve? A mapping diagnostic is often the best starting point. Let’s talk about it.